Data Science
Cleaning Messy Survey Data: A Practical Checklist
August 04, 2026 · Super Admin · 47 views
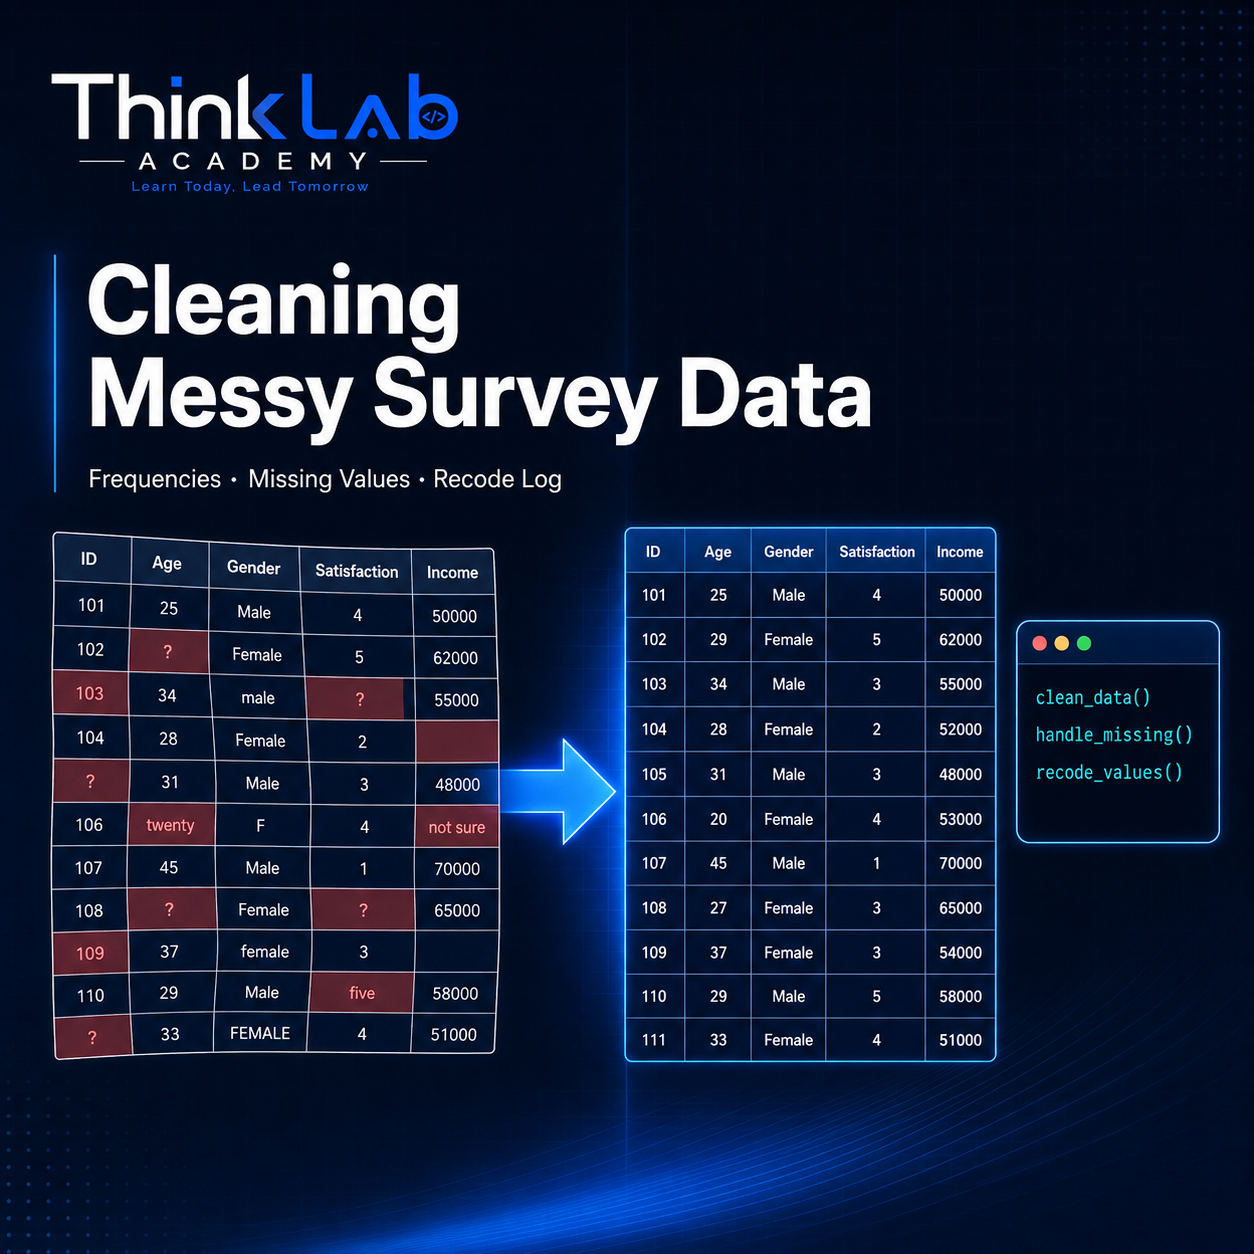
Every experienced analyst knows that the modelling is the short part of the job. Most of the time goes into cleaning, and most of the errors that survive into published tables were introduced during cleaning rather than during analysis. A repeatable checklist protects you from both problems, and it works the same whether you are in SPSS, Stata, R or Python.
Freeze the raw file and work on a copy. Save the original export from your survey platform or data entry sheet and never touch it again. Do all recoding in a working copy, and make every change through code rather than by hand: syntax in SPSS, a do-file in Stata, a script in R or Python. If a value is edited by clicking into a cell, that change is invisible six months later when a reviewer asks how many cases were excluded.
Run frequencies on everything before you trust anything. A frequency table on every variable is the fastest way to find the classic problems: an age of 210, a gender coded 3, a district spelled four different ways, a Likert item holding a 9 that was meant to signal missing. Cross-check a few impossible combinations too, such as respondents reporting no land but a positive harvest, since logically inconsistent records rarely show up in single-variable summaries.
Decide how missing data will be handled, and say so. First distinguish genuinely missing from not applicable and from refused, giving each its own code. Then look at the pattern: a variable missing in two per cent of cases is a different problem from one missing in thirty per cent. Listwise deletion is acceptable when losses are small and appear random; mean substitution is weak and inflates apparent precision; multiple imputation is defensible but must be reported. Whatever you choose, state the rule in your methodology and apply it consistently.
Recode and construct variables in a documented, reversible way. Create new variables rather than overwriting old ones, so that income and income_group both exist. Keep a short log with one line per transformation: what was changed, why, and how many cases it affected. Reverse-score negatively worded scale items before computing composite scores, and check reliability again after the scale is built.
Finish with a verification pass. Recount your sample size and reconcile it with the number of questionnaires collected. Re-run descriptives to confirm every variable now sits inside a plausible range. Then save the cleaned dataset under a dated filename and archive the script alongside it. A dataset that can be rebuilt from raw data in one command is the real deliverable of the cleaning stage, and it is what makes your results reproducible rather than merely presentable.
Comments (0)
Be the first to comment.