Research
Getting Started with SPSS: A Practical Guide for Researchers
August 04, 2026 · Super Admin · 47 views
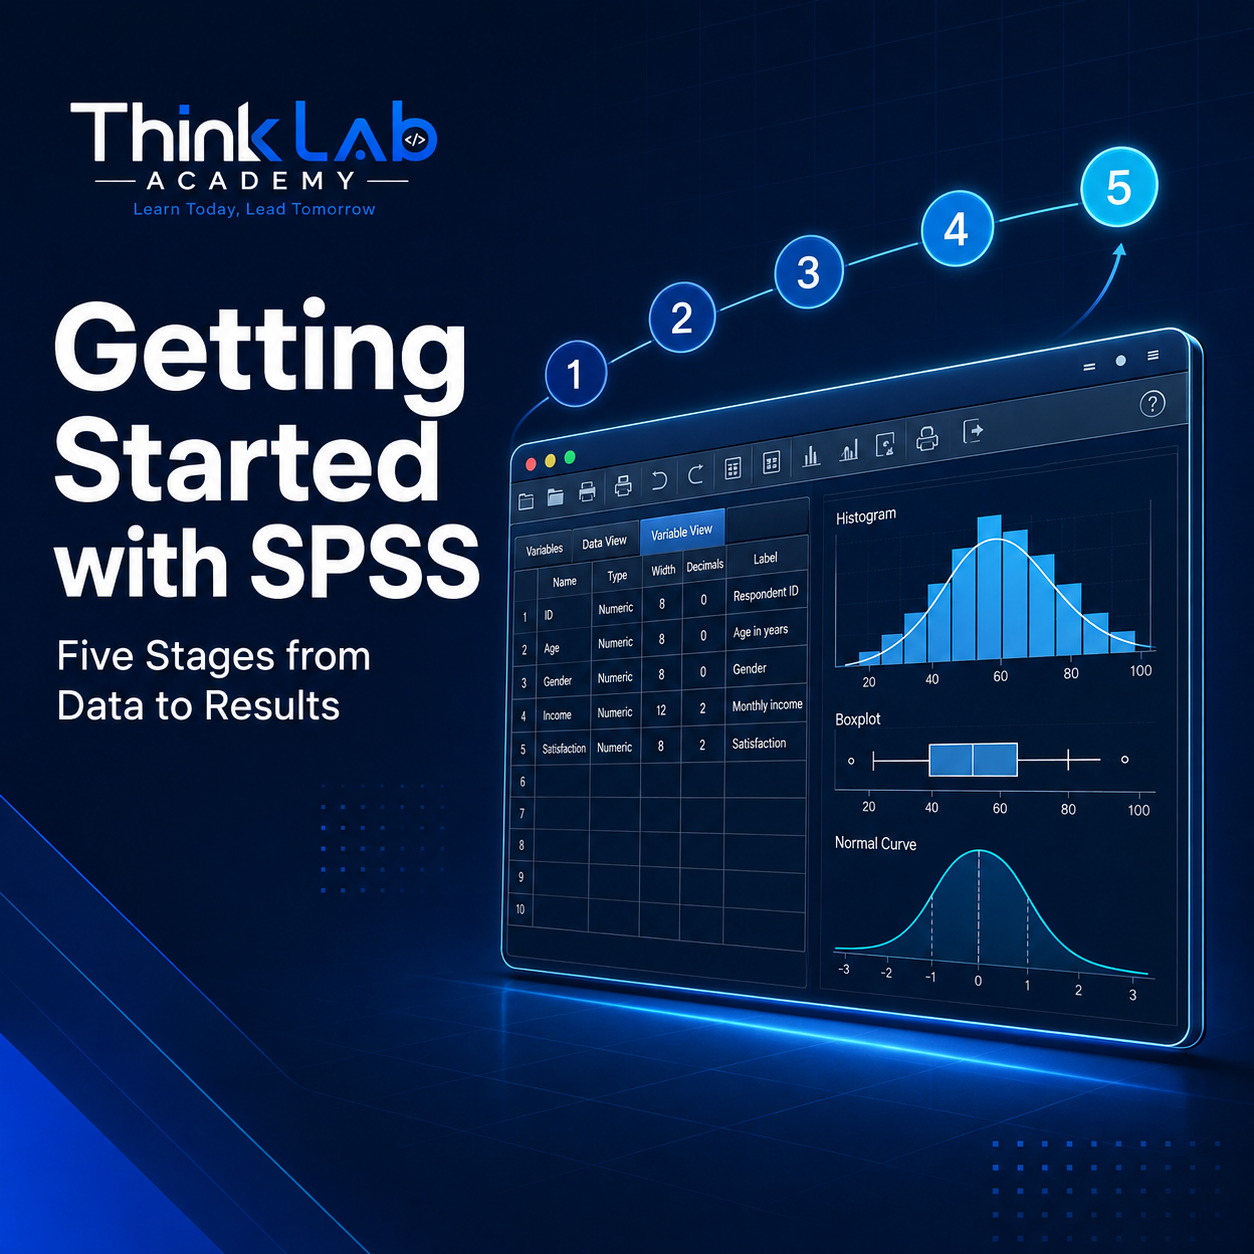
Most postgraduate students meet SPSS for the first time when data collection is already finished and a deadline is uncomfortably close. The software feels intimidating mostly because nobody explained the order in which things should happen. In reality almost every quantitative analysis follows the same five stages, and once you internalise them SPSS becomes a calm, predictable tool.
Stage 1 - Build a clean data file first. Open Variable View before Data View. Give every variable a short machine-friendly name, a full label that matches the wording of your questionnaire, correct value labels for coded answers, and an explicit missing-value code. Choose the measurement level honestly: nominal, ordinal or scale. Ten quiet minutes here saves hours later, because SPSS decides which tests and charts it offers you based on these settings.
Stage 2 - Screen, then describe. Run frequencies on every variable before anything else. This single habit catches most data-entry disasters: an age of 210, a gender coded 3, a Likert item with a value of 9 that was supposed to mean missing. Only when the frequencies look sensible should you move on to means, standard deviations, skewness and kurtosis. Report your sample profile in one well-formatted table rather than scattering numbers through the text.
Stage 3 - Test the assumptions, not just the hypothesis. Beginners often jump straight to a t-test or ANOVA and discover only later that the assumptions were violated. Check normality with Shapiro-Wilk or through skewness and kurtosis, check homogeneity of variance with Levene's test, and look for outliers with boxplots. When assumptions fail, SPSS offers solid non-parametric alternatives: Mann-Whitney instead of an independent t-test, Wilcoxon instead of a paired t-test, and Kruskal-Wallis instead of one-way ANOVA. Reporting the honest test is always better than defending a fragile one.
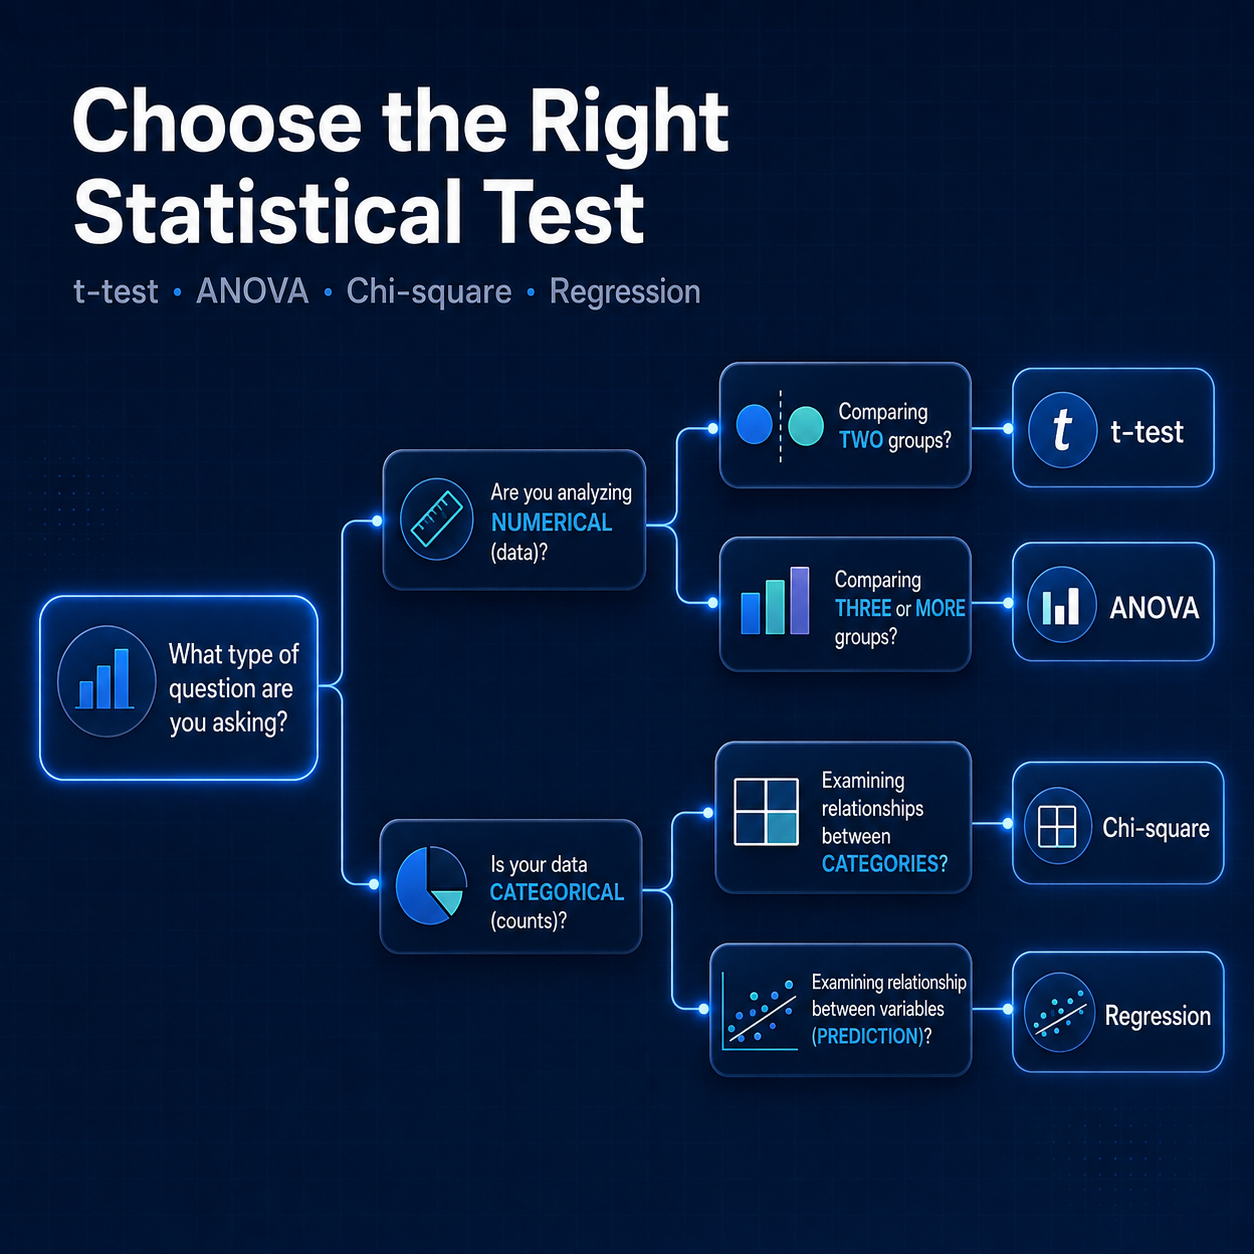
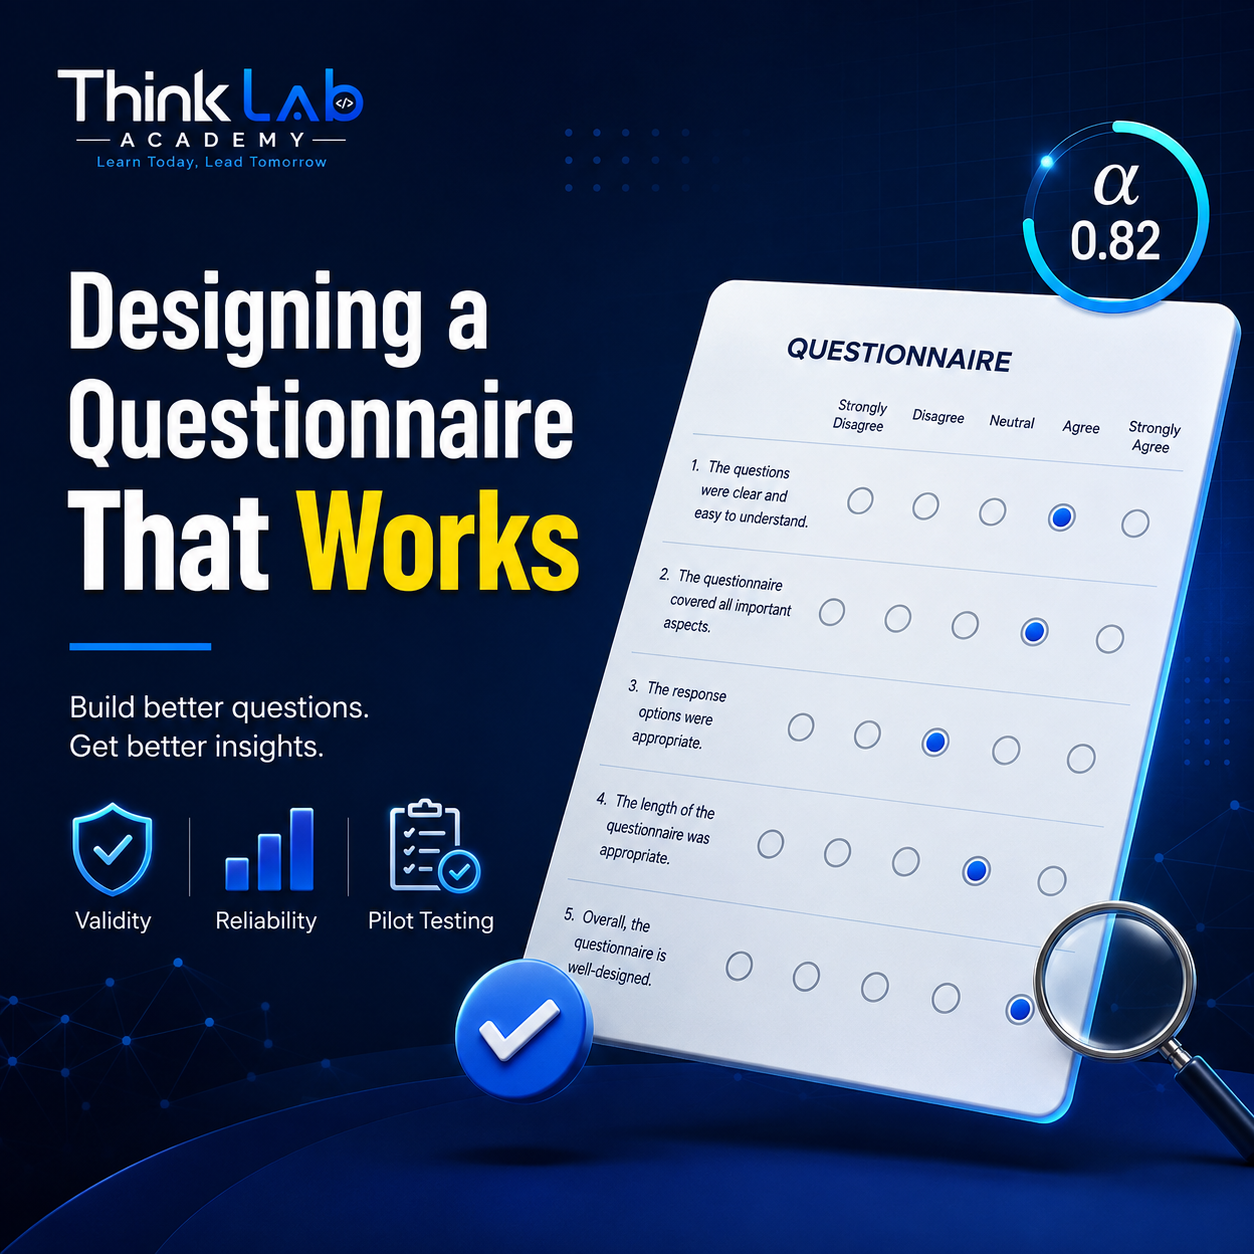
Stage 4 - Match the test to the research question. Write your hypotheses on paper first, then map each one to a test. Two independent groups with a continuous outcome means an independent-samples t-test. Three or more groups means ANOVA with a post-hoc comparison. Two categorical variables means chi-square. A continuous predictor with a continuous outcome means correlation and then linear regression. A binary outcome means logistic regression. Reliability of a multi-item scale means Cronbach's alpha. This mapping, not the software, is where the real thinking happens.
Stage 5 - Report the way journals expect. SPSS output is not a results section. Rebuild each finding into a clean table with the statistic, degrees of freedom, exact p-value and an effect size such as Cohen's d, eta squared or an odds ratio. Round sensibly, and follow every table with one plain sentence explaining what the number means for your research question.
Three habits that protect your thesis. Save your work as syntax, because every menu click in SPSS can be pasted as syntax and a saved .sps file lets you reproduce the whole analysis when your supervisor asks for one more variable. Keep the raw data untouched in a separate file and do all recoding in a working copy. Finally, document every recode and every excluded case in a short analysis log, because examiners frequently ask about it.
Follow this order and SPSS stops being a black box. It becomes what it was designed to be: a fast route from a questionnaire to defensible evidence.
Comments (0)
Be the first to comment.