Research
How to Choose the Right Statistical Test for Your Thesis
August 04, 2026 · Super Admin · 42 views
Ask a supervisor what students get wrong most often in a quantitative thesis and the answer is rarely arithmetic. It is the choice of test. A regression is run where a chi-square belonged, an ANOVA is used on ordinal data, or a correlation is reported as if it proved causation. The good news is that test selection is not a matter of talent or memory. It is a short decision path, and you can walk it in five minutes if you know what to ask.
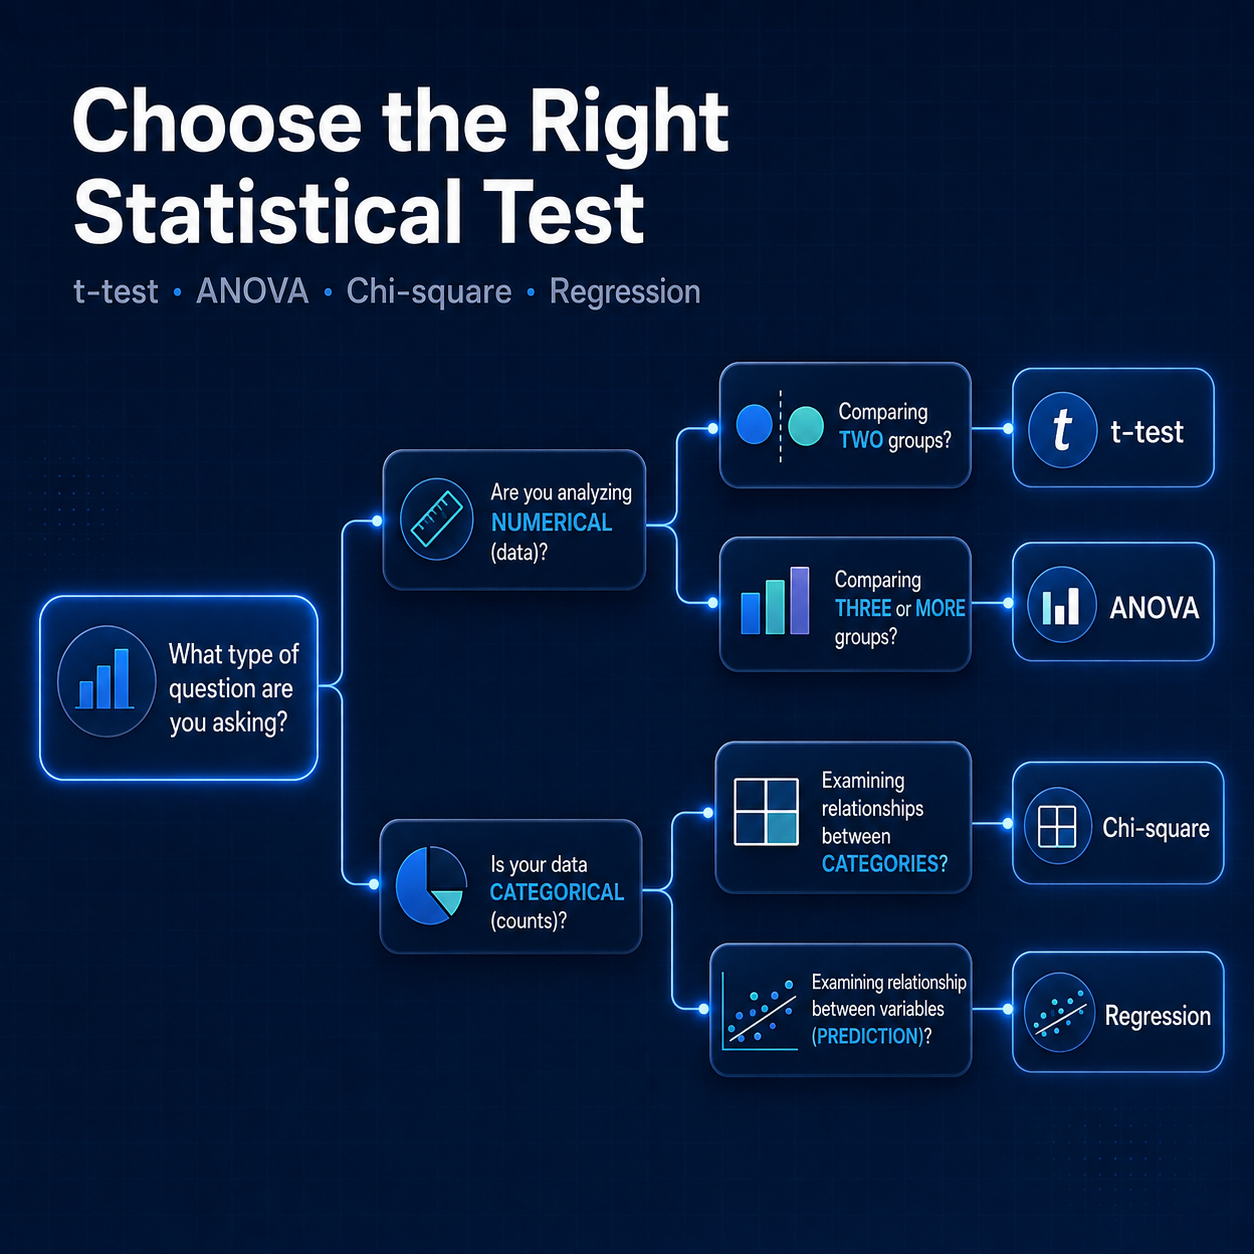
Start with the number and type of your variables. Write down your dependent variable and your independent variable, then label each one as categorical or continuous. A continuous outcome with a categorical predictor of two groups points to an independent-samples t-test. Three or more groups points to one-way ANOVA. Two categorical variables point to chi-square. A continuous predictor with a continuous outcome points to correlation, and then to regression if you want prediction rather than association. A binary outcome such as adopted or not adopted points to logistic regression. Almost every undergraduate and master's analysis lives inside that short list.
Then ask whether your groups are independent or paired. Comparing two different sets of farmers is independent. Comparing the same farmers before and after a training programme is paired, and it needs a paired-samples t-test rather than an independent one. Getting this wrong inflates your error and is easy for an examiner to spot in a single glance at your design section.
Check the assumptions before you trust the output. Parametric tests expect roughly normal distributions, reasonably equal variances and no extreme outliers. Test normality with Shapiro-Wilk and inspect skewness and kurtosis; test equality of variance with Levene's test; find outliers with boxplots. When assumptions fail, do not force the parametric test. Use Mann-Whitney in place of an independent t-test, Wilcoxon signed-rank in place of a paired t-test, Kruskal-Wallis in place of one-way ANOVA, and Spearman's rho in place of Pearson's r. A non-parametric result honestly reported is far stronger than a parametric result quietly defended.
Finally, report effect size, not just significance. A p-value tells you whether an effect is unlikely to be zero; it says nothing about whether the effect matters. Pair every test with its effect size: Cohen's d for t-tests, eta squared or partial eta squared for ANOVA, Cramer's V for chi-square, R squared for regression, and odds ratios for logistic models. Two sentences after each table, explaining direction and practical meaning, will do more for your defence than another decimal place of precision.
If you build this habit early, the software becomes irrelevant. SPSS, Stata, R and Python all run the same tests; what separates a convincing thesis from a shaky one is whether the test answered the question you actually asked.
Comments (0)
Be the first to comment.